The 11-Year Solar Cycle
The density of ionospheric layers depends on the amount of solar radiation reaching the Earth, but solar radiation is not constant. Variations result from daily and seasonal motions of the Earth, the sun’s own 27-day rotation and the 11-year cycle of solar activity. One visual indicator of both the sun’s rotation and the solar cycle is the periodic appearance of dark spots on the sun, which have been observed continuously since the mid18th century. On average, the number of sunspots reaches a maximum every
10.7 years, but the period has varied between 7 and 17 years. Cycle 19 peaked in 1958, with an average sunspot number of over 200, the highest recorded to date. Fig 21.11 shows average monthly sunspot numbers for the past four cycles.
Sunspots are cooler areas on the sun’s surface associated with high magnetic activity. Active regions adjacent to sun-spot groups, called plages, are capable of producing great flares and sustained bursts of radiation in the radio through X-ray spectrum. During the peak of the 11-year solar cycle, average solar radiation increases along with the number of flares and sunspots. The ionosphere becomes more in- tensely ionized as a consequence, resulting in higher critical frequencies, particularly in the F2 layer. The possibilities for long-distance communications are considerably improved during solar maxima, espe- cially in the higher-frequency bands.
One key to forecasting F-layer critical frequencies, and thus long-distance propagation, is the intensity of ionizing UV and X-ray radiation. Until the advent of satellites, UV and X-ray radiation could not be measured directly, because they were almost entirely absorbed in the upper atmosphere. The sunspot number provided the most convenient approximation of general solar activity. The sunspot number is not a simple count of the number of visual spots, but rather the result of a complicated formula that takes into consideration size, number and grouping. The sunspot number varies from near zero during the solar-cycle minimum to over 200.
Another method of gauging solar activity is the solar flux, which is a measure of the intensity of 2800-MHz (10.7 cm) radio noise coming from the sun. The 2800-MHz radio flux correlates well with the intensity of ionizing UV and X-ray radiation and provides a
 convenient
alternative to sunspot numbers. It commonly varies on a scale of 60-300
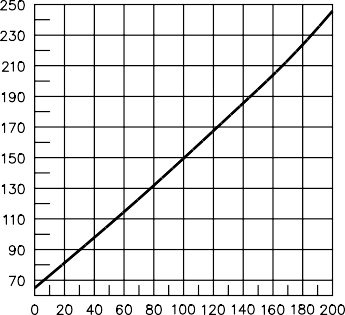
and can be related to sunspot numbers, as shown in Fig 21.12. The
Dominion Radio Astrophysical Observatory, Penticton, British Columbia,
measures the 2800-MHz solar flux
 Fig
21.11—Average monthly sunspot numbers for Solar Cycles 19 to 22.
Fig 21.12—Approximate conver- sion between solar flux and sunspot number.
daily at local noon. (Prior to June 1991, the Algonquin Radio Observatory, Ontario, made the measure- ments.) Radio station WWV broadcasts the latest solar-flux index at 18 minutes after each hour; WWVH does the same at 45 minutes after the hour. The Penticton solar flux is employed in a wide variety of other applications. Daily, weekly, monthly and even 13-month smoothed average solar flux readings are commonly used in propagation predictions.
High flux values generally result in higher MUFs, but the actual procedures for predicting the MUF at any given hour and path are quite complicated. Solar flux is not the sole determinant, as the angle of the sun to the Earth, season, time of day, exact location of the radio path and other factors must all be taken into account. MUF forecasting a few days or months ahead involves additional variables and even more uncertainties.
