Ionospheric Refraction
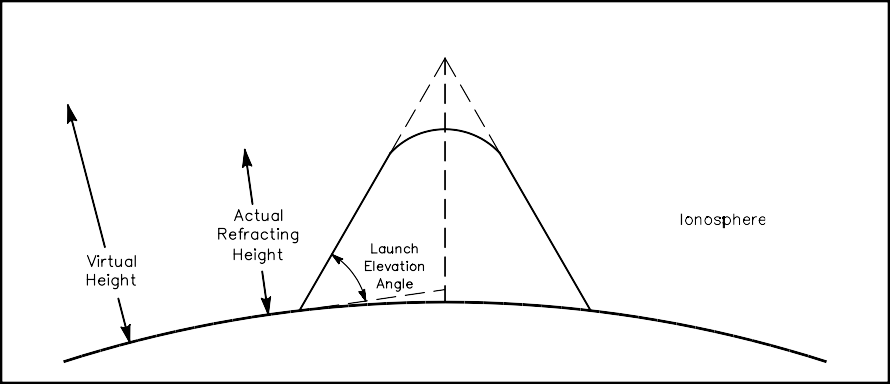
The refractive index of an ionospheric layer increases with the density of free-moving electrons. In the most dense regions of the F layer, that density can reach a trillion electrons per cubic meter (1012 e/m3). Even at this high level, radio waves are refracted gradually over a considerable ver- tical distance, usually amounting to tens of km. Radio waves become useful for terrestrial propa- gation only when they are refracted enough to bring them back to Earth. See Fig 21.7.
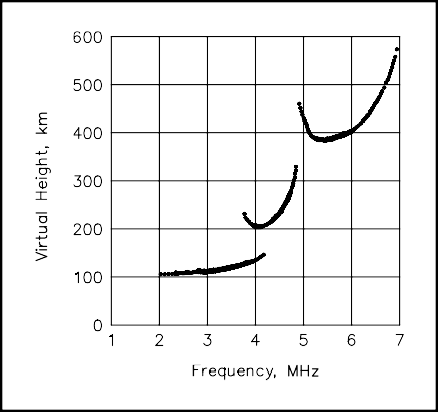
Although refraction is the primary mechanism of ionospheric propagation, it is usually more conve- nient to think of the process as a reflection. The virtual height of an ionospheric layer is the equivalent altitude of a reflection that would produce the same effect as the actual refraction. The virtual height of any ionospheric layer can be determined using an ionospheric sounder, or ionosonde, a sort of vertically oriented radar. The ionosonde sends pulses that sweep over a wide frequency range, generally from 2 MHz to 6 MHz or higher, straight up into the ionosphere. The frequencies of any echoes are recorded against time and then plotted as distance on an ionogram. Fig 21.8 depicts a simple ionogram.
The highest frequency that returns echoes at vertical incidence is known as the vertical incidence or critical frequency. The critical frequency is almost totally a function of ion density. The higher the ionization at a particular altitude, the higher becomes the critical frequency. Physicists are more apt to call this the plasma frequency, because technically gases in the ionosphere are in a plasma, or partially ionized state. F-layer critical frequencies commonly range from about 1 MHz to as high as 15 MHz.

Fig 21.7—Gradual refraction in the ionosphere allows radio sig- nals to be propa-gated long distances. It is often convenient to imagine the process as a reflection with an imaginary reflection point at some virtual height above the actual refracting region. The other figures in this chapter show ray paths as equivalent reflections, but you should keep in mind that the actual process is a gradual refraction.
 Fig
21.8—Simplified vertical incidence ionogram showing echoes returned
from the E, F1 and F2 layers. The critical frequencies of each layer
(4.1,
4.8 and 6.8 MHz) can be read directly from the ionogram scale.
